₹7.85 lakh crore a year, rerouting home.
The full demand equation: what India spends, what it builds domestically, what it still buys abroad, and the export line that grew 25x in nine years.
Domestic vs foreign sourcing
Production ₹1,54,000 Cr (FY25) vs continued top-2 global import position — the substitution gap is the thesis.
~8% annualised growth FY17→FY25 · DPSUs ~79% / private ~21% of production
FY25: ₹23,622 Cr — private sector 64.5% / DPSU 35.5% · FY17 base: ₹1,521 Cr (25x)
World's #2 importer 2020–24 (after Ukraine) — still importing engines, subs, seekers
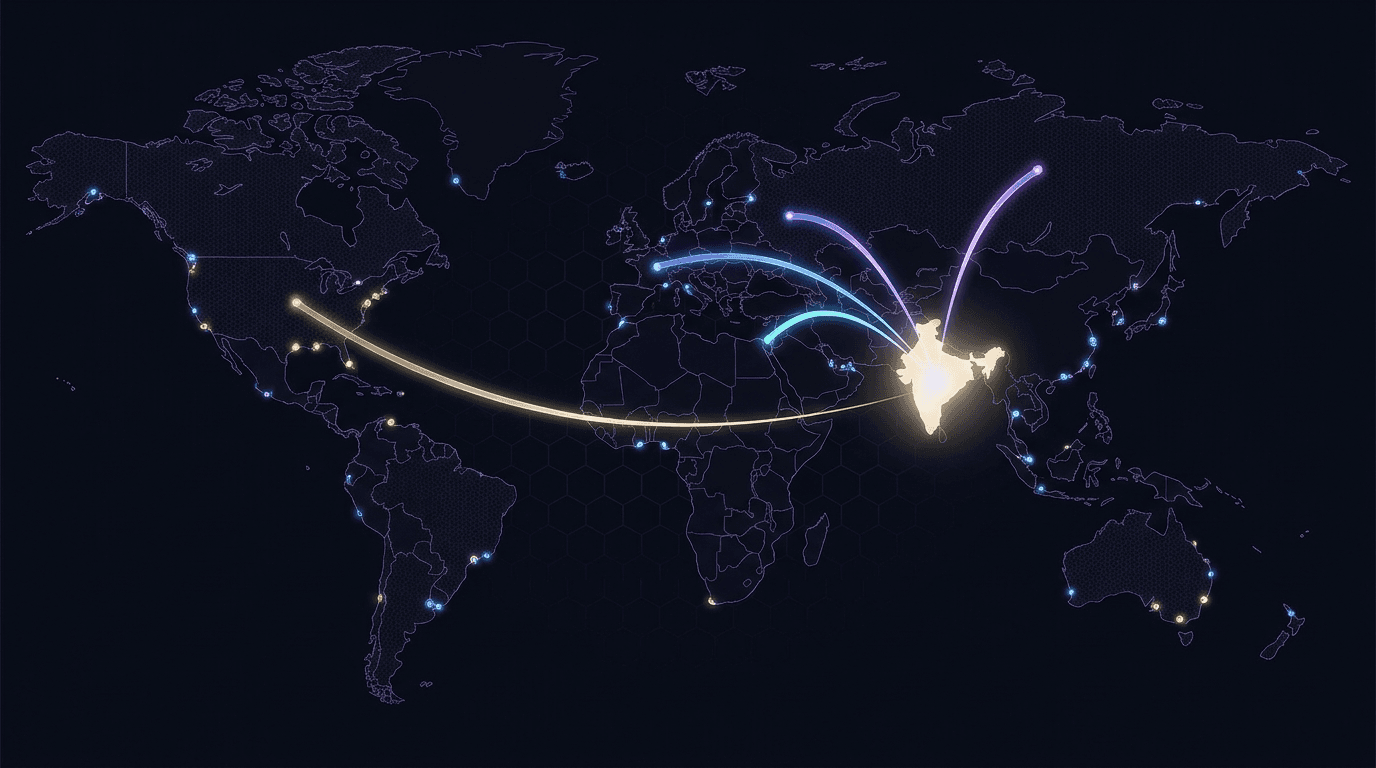
Supplier concentration
Share of Indian arms imports, 2020–24 · SIPRI
▼ from 55% (2015-19) and 72% (2010-14) · Risk: Sanctions exposure, spares delays, payment friction
▲ Rafale, Scorpène, engines · Risk: High cost, limited ToT on engines
▲ EW, drones, missiles, AESA · Risk: Supply strain during regional conflicts
▲ P-8I, Apache, GE F404/F414 engines · Risk: ITAR controls, end-use monitoring
South Korea (K9), Germany (subs bid) · Risk: —
The export line
₹1,521 Cr → ₹38,424 Cr in 9 yearsBrahMos (Philippines), Akash (interest: Brazil, Armenia), Pinaka (Armenia), artillery + ammunition (Europe restocking). Private sector supplies ~two-thirds of exports.
The machine-building base rate
Sources: PIB / MoD Union Budget 2026-27 releases; MP-IDSA budget analysis. SIPRI Trends in International Arms Transfers 2024 (fact sheet, Mar 2025). Ministry of Defence export statistics FY25 / FY26. IBEF Engineering & Capital Goods reports; Invest India. Import-share bars scaled for readability; percentages are of Indian arms-import TIV.